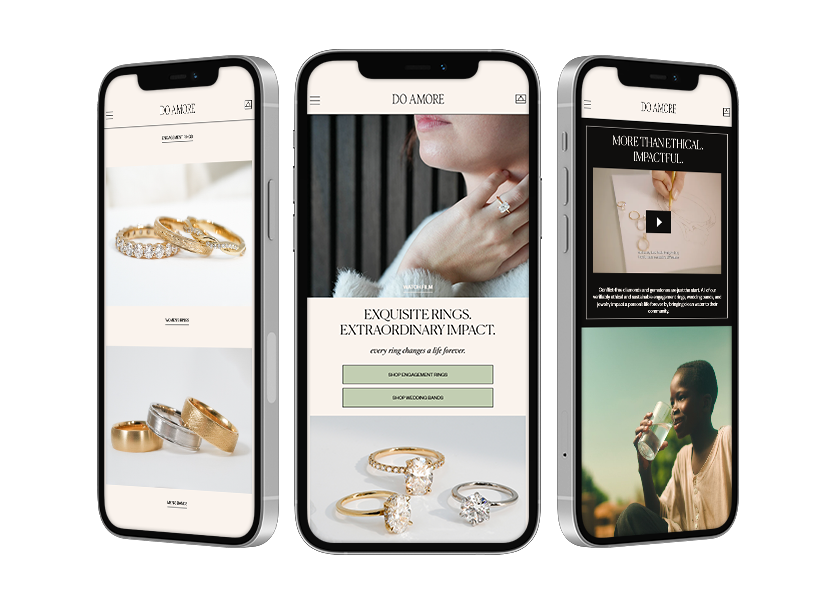
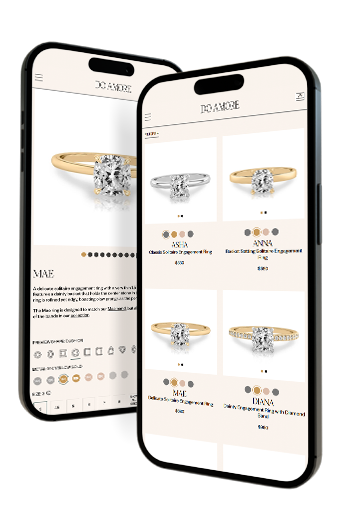
Do Amore’s primary goal when they reached out to Taktical was simple: increase revenue and purchases at a scalable Return on Ad Spend (ROAS). Because the strategy for achieving these goals involved advertising on Facebook, Taktical’s main challenge at the start of this project came in the form of the minimal resources the company had devoted to Facebook marketing campaigns. Up to that point, Do Amore’s Facebook marketing efforts had only yielded a few purchases and not much in revenue.
Results
+1139%
Yearly Revenue
2.7
ROAS
Strategy
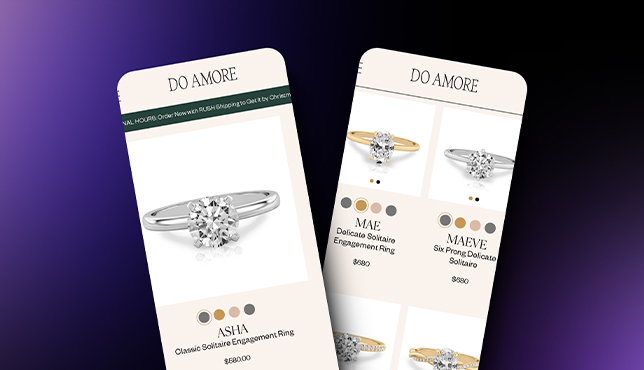
Taktical dramatically boosted the sales and revenue attributed to Do Amore’s Facebook marketing campaigns. In our biggest month (Nov. 2019), we achieved 2.7 ROAS. Ultimately, we increased yearly revenue (Facebook-specific) by over 1000% over 3 years.
We did so by focusing on segmenting Facebook audiences by gender while allowing them to remain broad in terms of the number of users in each audience. This allowed us to keep campaigns active for relatively long periods of time, which in turn allowed Facebook’s algorithm to “learn” more effectively.
We also optimized individual ads for separate levels of intent. For example, some ads were optimized for users who were ready to make a purchase, while others were optimized for users who were interested in the brand, but not ready to buy a ring from them yet. This allowed Taktical to retarget leads who hadn’t reached the end of the sales funnel.
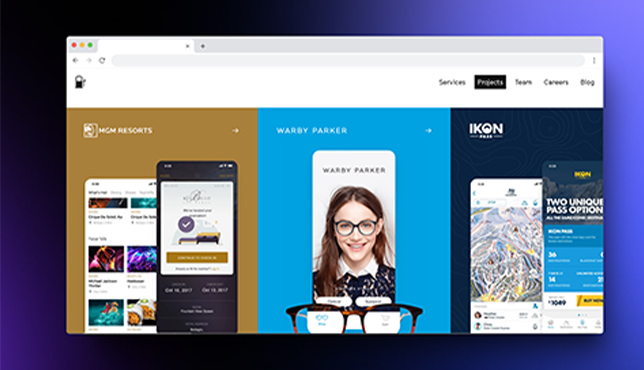
Case Studies
Fueled offers mobile app design and development, web-based product design and development, and digital transformation services.
Great team and great partnership, with the ability to understand the nuances across the different channels as it relates to the business. Looking to grow the business further.
Anthony Milano / VP, E-Commerce & Digital
BE KIND. by ellen is a subscription box featuring handpicked products from Ellen DeGeneres. Each box includes more than $200 worth of products, and boxes are delivered seasonally, four times a year.
Homepolish offers a smart, accessible, and personal service that’s revolutionizing the interior design industry. Whether a customer is merely accessorizing or they’re fully gut-renovating, Homepolish delivers effective solutions.
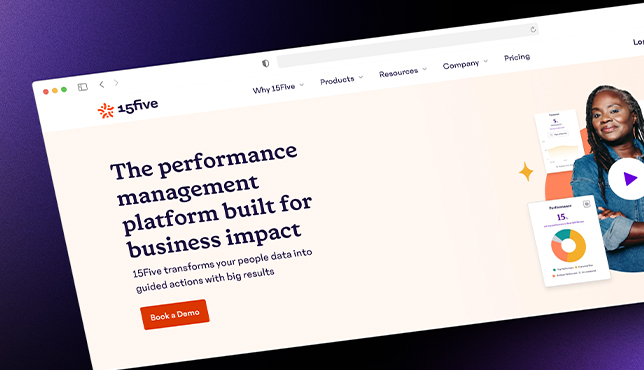
15Five offers companies worldwide an employee engagement and performance management software suite that allows users to integrate objectives into weekly check-ins, set up and view objectives, update employee progress, and post comments in real time.